

Want to see live-updating resource usage stats from your system’s CPU, memory, disk, network or GPU? Windows 10 has some built-in perfomance monitors that can help. You can even have Windows show these panels always on top of other open windows.
The best way is to use the Task Manager.. It has some easy-to-ise performance panels displaying real time stats of your machine. Let’s explore how to use this feature.
This is for Windows 10 operating system

Check out TechSavvy.Life for their blog posts on smartphone apps, PCs. and Macs!
Tweet
Open the Task Manager
Windows 10’s Task Manager comes with performance stats that were added back in Windows 8. This post relates to Windows 10.
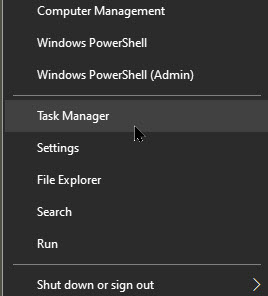
First, open the Task Manager by pressing Ctrl-Alt-Del and choosing Task Manager or by right-clicking the Taskbar or the Start button and selecting Task Manager. Refer to below image:
Floating Panels
Now, select the Task Manager Options and chose Always on Top if you want the tool’s panels to appear on top of other open windows. See below image:

The Performance Tab
Next, click thePerformace tab. If you don’t see it, click More Details first, at the bottom of your screen. See following image:

Now, choose the performance graph from the sidebar you want to see. You will see options for your computer’s CPUs, memory, storage devices (including SSDs, hard disks, and USB devices), network connections (wired Ethernet and Wi-Fi), and GPUs (graphics processors.)
To show just a performance graph, double-click anywhere on a graph in the right pane. You can also right-click a graph and select Graph Summary View. Refer to below image:

The Performance Graphs
You can resize this smaller window and also click-and-drag anywhere inside it to position it wherever you like on your desktop. See below image:

To enlarge or make the Task Manager window smaller, just double-click inside it,
If you want to change the graph to another one just right click in the graph, chose the View option and make your selection. See following image:

Also, you can select a different graphfrom the sidebar. Refer to below image:

That’s it. I hope you found this post helpful.
I have found TechSavvy.Life blog posts extremely helpful. Check them out for posts on smart phone apps, Macs and PCs!
Tweet
I Would Like to Hear From You
Please feel free to leave a comment. I would love hearing from you. Do you have a computer or smart device tech question? I will do my best to answer your inquiry. Please mention the device, app and version that you are using. To help us out, you can send screenshots of your data related to your question.
