How to Use Paste Special for Simple Calculations in Microsoft Excel

Do you find yourself doing a lot of copy and paste of data in your spreadsheets? Did you know that you can use a special Excel’s paste feature to perform simple calculations? You can add, subtract, multiply, or divide in a few clicks with the paste special in Excel.

RAYMOND OGLESBY @RaymondOglesby2
October 26, 2021

Do you find yourself doing a lot of copy and paste of data in your spreadsheets? Did you know that you can use a special Excel’s paste feature to perform simple calculations? You can add, subtract, multiply, or divide in a few clicks with the paste special in Excel. Let’s see how this is done.

This is for devices using Microsoft Excel. We are using Excel for Office 365.

Dilbert and Like
Copyright Scott Adams, Inc./Distributed by Universal Uclick for UFS

Maybe you have prices that you want to increase or costs that you want to decrease by dollar amounts. Or, perhaps you have inventory that you want to increase or decrease by unit amounts. You can perform these types of calculations quickly on a large number of cells with Excel’s paste special operations.

Setup Paste Special

For each of your simple calculations, you will open the Paste Special dialog box. Next, you will start copying the data and then selecting the cell(s) that you are pasting to.

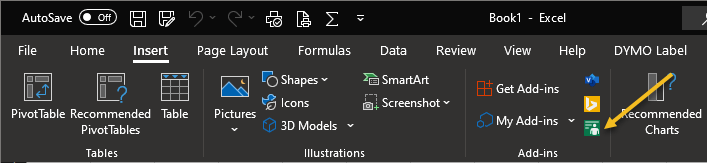
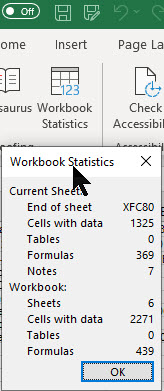
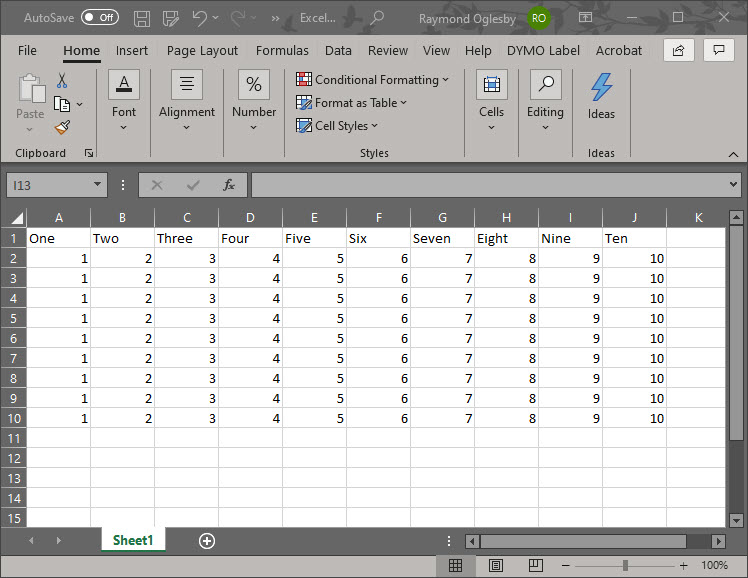
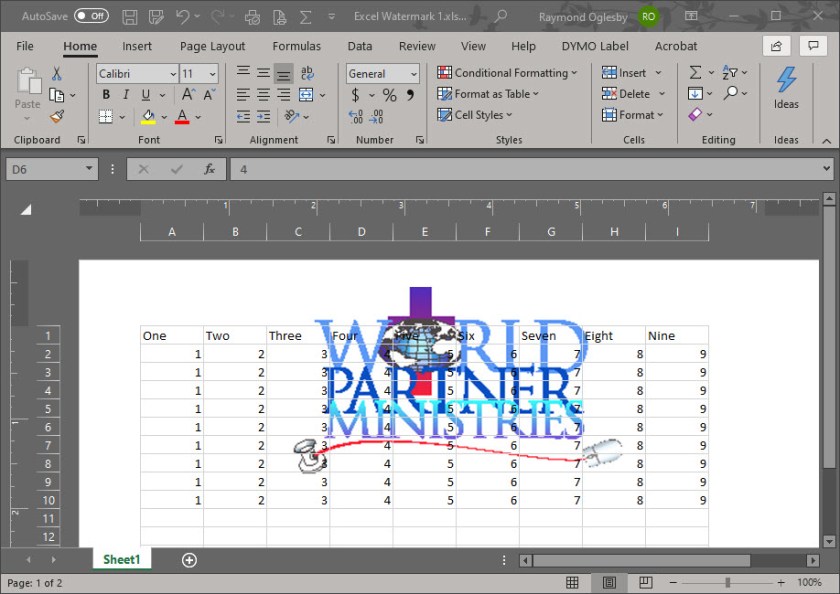
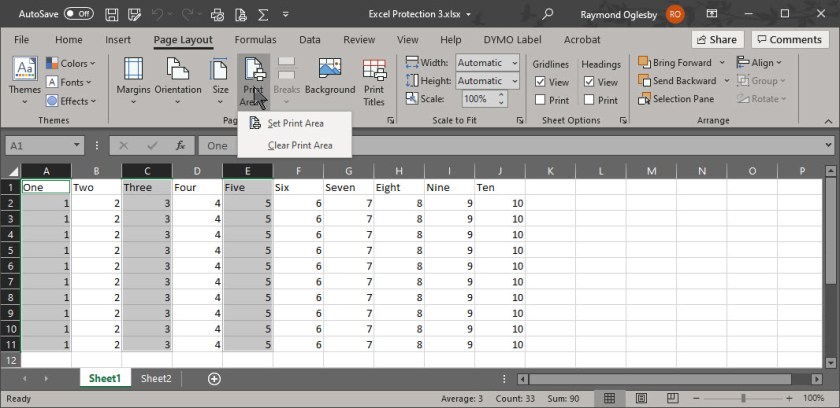
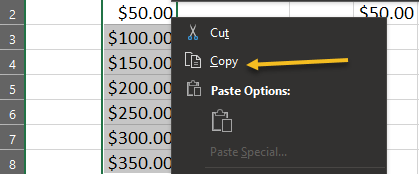
First, open Microsoft Excel. To copy, you can press Ctrl+C or right-click and select Copy. Refer to below image:

Paste Special 1
Selecting Copy option

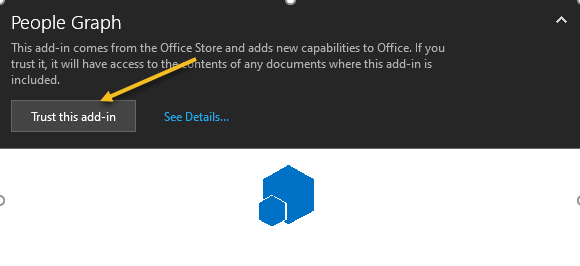
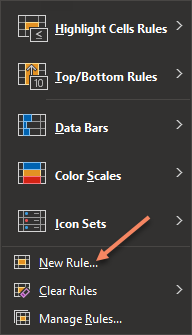
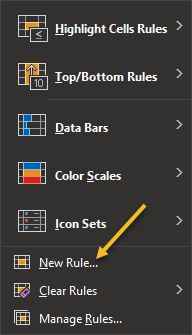
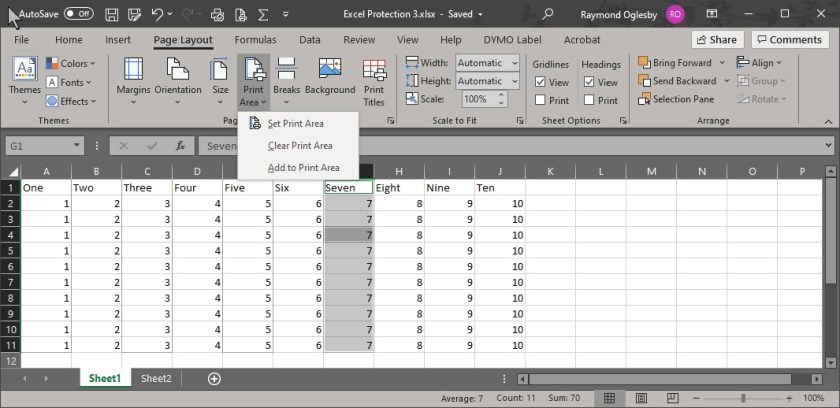
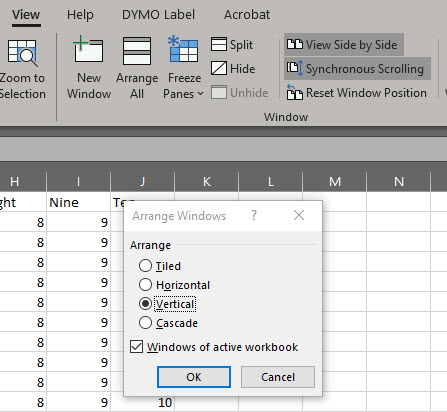
Now, do one of the following to access Paste Special.

  • Click the Paste drop-down arrow in the ribbon on the Home tab, then select Paste Special.
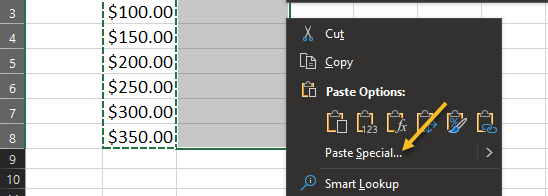
  • Right-click cells that you are pasting to and select Paste Special in the shortcut menu.

See below image:

Paste Special 2
Selecting Paste Special option

Use Simple Calculations With Paste Special

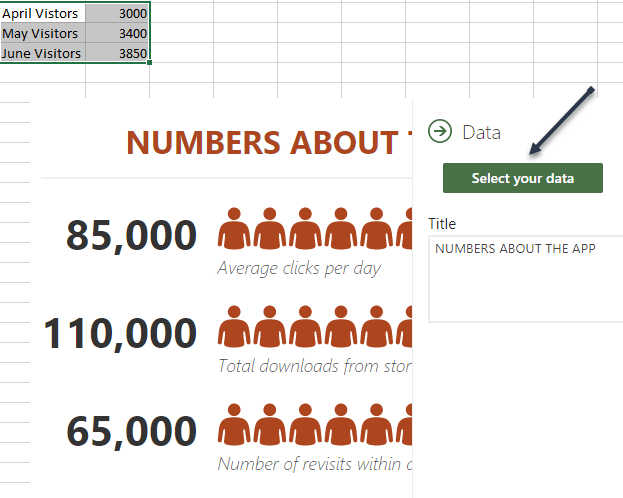
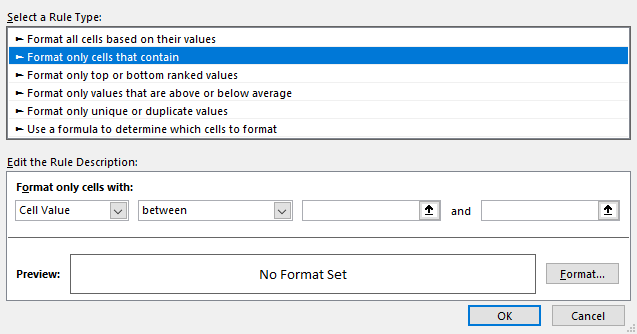
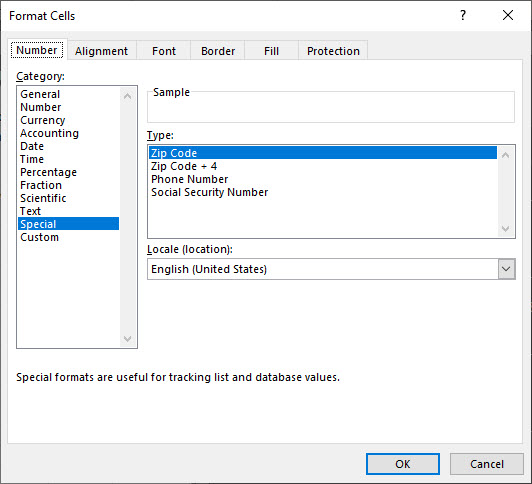
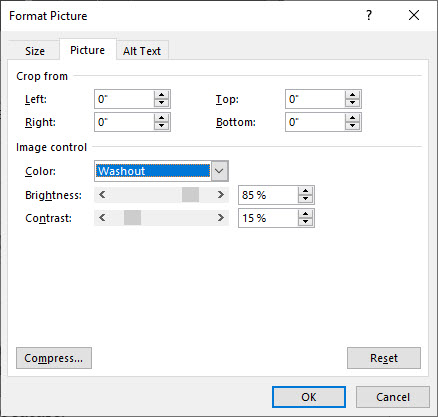
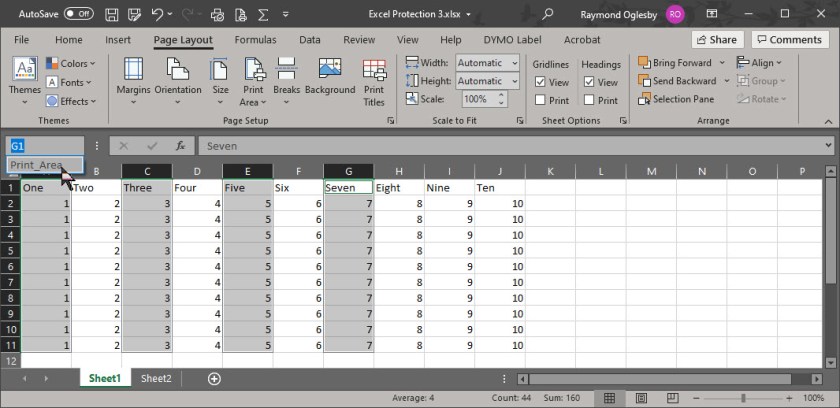
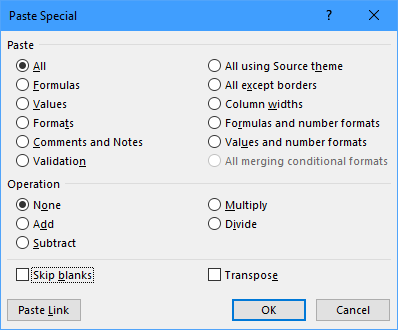
For basic numbers, decimals, and currency, you can choose from All, Values, or Values and Number Formats in the Paste section of the window. Use the best option for your data.

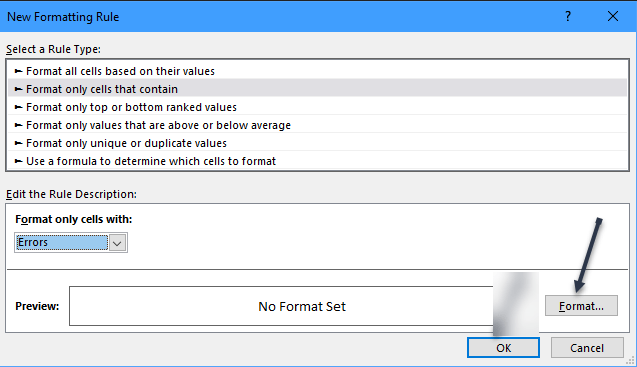
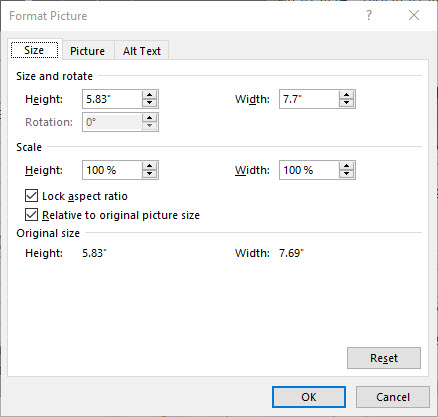
Next. you will use the section labeled Operation to add, subtract, multiply, or divide. See following image:

Paste Special 3
The Paste Special dialog box

Let’s look at a simple example of one operation to see how it all works.

Add With Paste Special

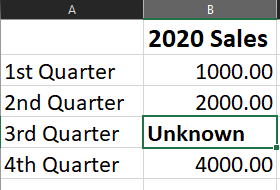
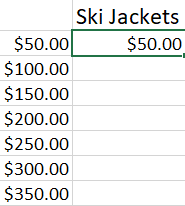
For this example, we want to add $50 to each of the amounts for our ski jacket prices to accommodate an increase.

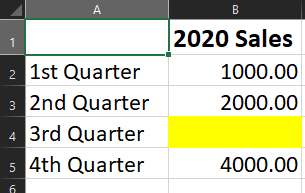
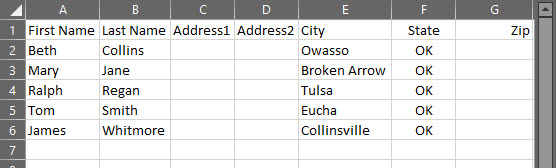
We enter $50 into a cell outside of our data set and copy it. You might already have the data in your sheet or workbook that you need to copy. Refer to below image:

Paste Special 4
Selecting the amount for the increase

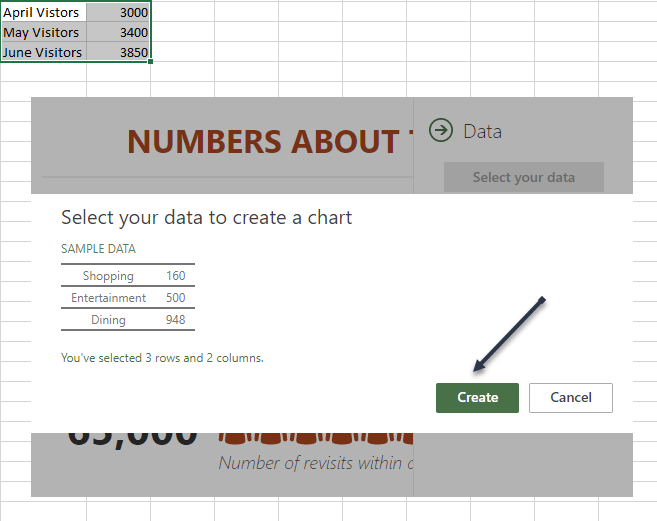
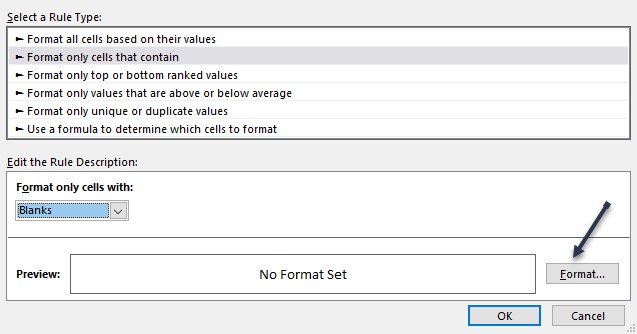
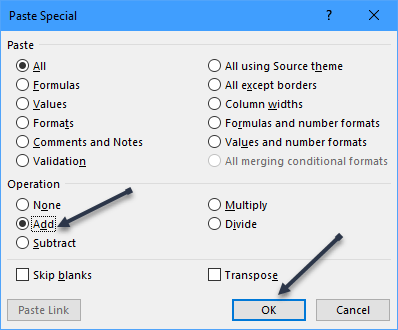
Now, we select the cells that we want to add $50 to and access Paste Special as described. Next, we choose Add in the Operation section and click OK. See below image:

Paste Special 5
Selecting to Add

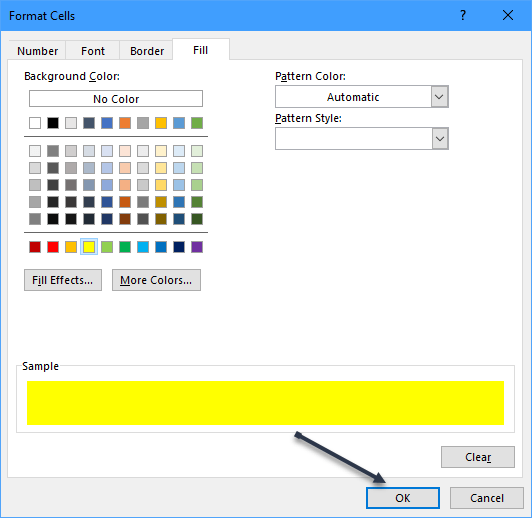
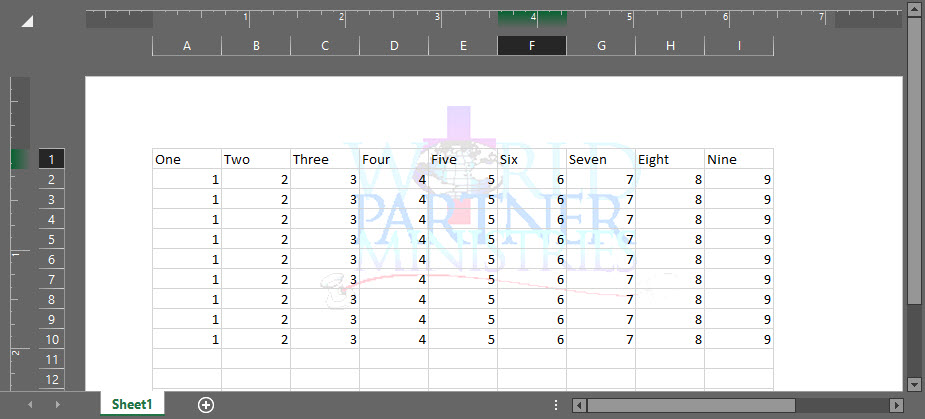
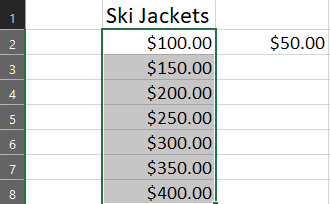
And that’s it. All of the cells in your selection have increased by $50. See following image:

Paste Special 6
Your final result; all Ski Jackets are increased by $50

Subtract, multiply, or divide an amount works the same way. For multiply or divide, you would use units instead of currency.

Be sure to switch the operation back to None when you are finished.

The next time you need to add, subtract, multiply, or divide a large group of cells in Excel by the same amount, remember this trick using Paste Special.

Quote For the Day

I’m sorry, if you were right, I’d agree with you.

Robin Williams

That’s it. Please feel free to share this post! One way to share is via Twitter.

Just click the Tweet icon below. This will launch Twitter where you click its icon to post the Tweet.

Check out TechSavvy.Life for blog posts on smartphones, PCs, and Macs! You may email us at contact@techsavvy.life for comments or questions.

I Would Like to Hear From You

Please feel free to leave a comment. I would love hearing from you. Do you have a computer or smart device tech question? I will do my best to answer your inquiry. Just send an email to contact@techsavvy.life. Please mention the device, app and version that you are using. To help us out, you can send screenshots of your data related to your question.

The author’s Vietnam eBook on the Battle for Tra Bong Vietnam: Events and Aftermath
Advertisement

How to Add the Developer Tab in Office Apps

Sooner or later, you will need the Developer Tab in Word, Excel, PowerPoint, or Outlook. Even if you know nothing about programming, there are buttons on the Developer tab that are necessary for some of the clever features in Office.

RAYMOND OGLESBY @RaymondOglesby2
September 28, 2021

Sooner or later, you will need the Developer Tab in Word, Excel, PowerPoint, or Outlook. Even if you know nothing about programming, there are buttons on the Developer tab that are necessary for some of the clever features in Office.

The Developer tab is not displayed by default, but you can add it to the ribbon in a few easy steps.

This is for devices running Microsoft Office

Dilbert and Yets
Copyright Scott Adams, Inc./Distributed by Universal Uclick for UFS

First, open an Office app, like Word, and any document. Now, right-click within any Tab in the Ribbon and select Customize the Ribbon. Refer to below image:

Ribbon 1
Select Customize the Ribbon option

Next, in the right-hand side, select All Tabs from the drop down menu and simply checkmark the Developer tab box. Now, select OK to enable the Developer tab. See below image:

Ribbon 2
Enable the Developer tab

Next, exit your Office app, restart the app and load your document. You will see the Developer tab in your ribbon. Just click the tab to view its options. See following image:

Ribbon 3
Your Developer tab

Quote For the Day

‘Fahrenheit 451’ postulates a lot of things I didn’t want to have happen.

Ray Bradbury

That was easy. Please feel free to share this post! One way to share is via Twitter.

Just click the Tweet icon below. This will launch Twitter where you click its icon to post the Tweet.

Check out TechSavvy.Life for blog posts on smartphones, PCs, and Macs! You may email us at contact@techsavvy.life for comments or questions.

I Would Like to Hear From You

Please feel free to leave a comment. I would love hearing from you. Do you have a computer or smart device tech question? I will do my best to answer your inquiry. Just send an email to contact@techsavvy.life. Please mention the device, app and version that you are using. To help us out, you can send screenshots of your data related to your question.

The author’s Vietnam eBook on the Battle for Tra Bong Vietnam: Events and Aftermath

How to Create a People Graph in Excel

If you take advantage of Excel’s charts for helpful visual displays of your data, check out the People Graph option to create a simple depiction of the number of people or items you have logged in your spreadsheet.

RAYMOND OGLESBY @RaymondOglesby2
September 9, 2021

If you take advantage of Excel’s charts for helpful visual displays of your data, check out the People Graph option to create a simple depiction of the number of people or items you have logged in your spreadsheet.

This is for devices running Excel. Screenshots are from Excel for Office 365 and Windows 10.

Dilbert and Lunch
Copyright Scott Adams, Inc./Distributed by Universal Uclick for UFS

You can display things like the number of visitors to your website, downloads of your app, sign-ups for your event, calls to your support center, and much more.

Add People Graph Add-In

People Graph is an Add-In developed by Microsoft, and there’s already a button for it in your Excel ribbon. But before you can use it, you will have to trust the add-in to install it. First, open the Insert tab in Excel and look for the Add-ins group. Click the button for People Graph. Refer to below image:

Graph 1
Select the Add-In

Next, You will see a pop-up window with a link to See Details. This takes you to the Add-In on the Office Store, where you can read an overview, reviews, and other details. Click Trust this add-in to get started. See below image:

Graph 2
Trust the Add-In option

Now, once the add-in is installed in Excel, you can click the button on the Insert tab to use the feature.

Insert a People Graph

Whenever you hit the People Graph button in the ribbon, you will see a sample graph. First. click the Data icon that looks like a small grid. See following image:

Graph 3
Select the People Graph button

Optionally, you can enter your graph Title before selecting your data, or you can just head back to this spot to add the title later. Next, click Select your data, and then drag through the cells that you want to use. Currently, you must use two columns of data, but you can have multiple rows. Refer to below image:

Graph 4
Select your data

Now, click Create on the People Graph screen. See below image:

Graph 5
Create the People Graph

Customize Your People Graph

First, click the gear icon to open the Settings. You can then move through the three settings for type, theme, and shape. See following image;

Graph 6
Select the Settings gear icon

You can currently pick from three graph types. Each has a slightly different layout and appearance. Now, click Type, and then choose one on the right side. Refer to below image:

Graph 7
Select your Type of graph

Next, you can select a Theme that changes the background and colors of your graph. Click Theme, and choose one of the seven options. See below image:

Graph 8
Select your theme for the graph

Finally, you can use a different Shape. So if your data is better represented by a Shape other than people, you can choose the best fit. Now, click Shape and pick from the 16 options. See following image:

Graph 9
Select the Shape of your graph

Next, you can select and drag your People Graph wherever you want it on your spreadsheet. And if you edit the data on which the graph is based, Excel will update the graph automatically. Refer to below image:

Graph 10
Your final result

Other Options

On the top right of your People Graph, you will see an arrow (Windows) or an Info icon (Mac). When you click, you will see several actions .Choose Reload to refresh the graph, Delete to remove it, and Select to select the graph if you want to move it. You also have options to Get Support, Attach Debugger, and view the Security info. See below image:

Graph 11
Select Other Options

If you are looking for a simple way to visually display data, especially if it includes a number of people like customers, clients, or contacts, try out the People Graph in Microsoft Excel.

Quote For the Day

If you don’t like what you’re doing, then don’t do it

Ray Bradbury

That’s it. Please feel free to share this post! One way to share is via Twitter.

Just click the Tweet icon below. This will launch Twitter where you click its icon to post the Tweet.

Check out TechSavvy.Life for blog posts on smartphones, PCs, and Macs! You may email us at contact@techsavvy.life for comments or questions.

I Would Like to Hear From You

Please feel free to leave a comment. I would love hearing from you. Do you have a computer or smart device tech question? I will do my best to answer your inquiry. Just send an email to contact@techsavvy.life. Please mention the device, app and version that you are using. To help us out, you can send screenshots of your data related to your question.

The author’s Vietnam eBook on the Battle for Tra Bong Vietnam: Events and Aftermath

How to Highlight Blank or Error Cells in Excel

Spotting things in a spreadsheet can be much quicker when you nightlight them. With conditional formatting in Microsoft Excel, you can make finding blank cells or formula errors easier.

RAYMOND OGLESBY @RaymondOglesby2
August 26, 2021

Spotting things in a spreadsheet can be much quicker when you highlight them. With conditional formatting in Microsoft Excel, you can make finding blank cells or formula errors easier. Let’s explore how this feature works.

This is for devices running Microsoft Excel

Dilbert and Yoga
Copyright Scott Adams, Inc./Distributed by Universal Uclick for UFS

Highlight Blank Cells

When you have a spreadsheet full of data that you expect to fill every cell, you can easily overlook cells that are left empty.

First, open the sheet and select the cells where you want to apply the formatting. Next, go to the Home tab and click Conditional Formatting in the Styles group of the Ribbon. Now, choose New Rule. Refer to below image:

Excel 1
Select New Rule option

Next, in the New Formatting Rule window that appears, click Format only cells that contain under Select a Rule Type at the top. See below image:

Excel 2
Select a Rule Type option

Now, at the bottom, pick Blanks in the Format only cells with drop-down box. Next, click Format to the lower right of the preview to select how to format the blank cells. See following image:

Excel 3
Select Format Cells with blanks

Now, in the Format Cells window, use the tabs at the top for Font, Border, and Fill to choose your formatting. Click OK. For our example, we are using Fill to color our blank cells bright yellow. Refer to below image:

Excel 4
Select choose a Fill color

You will be back on the New Formatting Rule window, where you will see a preview of the formatting for blank cells. If you are happy with it, click OK to apply the conditional formatting. See below image:

Excel 5
Save your changes

You should then see any empty cells in the range that you selected highlighted with the formatting that you picked. See following image:

Excel 6
Your final result

Highlight Error Cells

Even though Microsoft Excel does a decent job of of pointing errors out to you, they might not be noticeable if you have a large sheet to scroll through. To make sure that you see the errors quickly, conditional formatting is the way to go.

You will actually follow the same process that you used in the previous section to highlight blanks, but with one difference.

First, switch to the Home tab, click Conditional Formatting, and then choose New Rule. Refer to below image:

Excel 7
Select New Rule option

Next, in the New Formatting Rule window, pick Format only cells that contain at the top. But this time, pick Errors in the Format only cells with drop-down box at the bottom. Now, click Format to choose the formatting. See below image:

Excel 8
Select Format for errors

For this example, adjust the Font options to make the cells with errors bold and red. Click OK. After you pick the formatting, click OK again to apply the rule. See following image:

Excel 9
Select formatting for errors

Now, those errors will be very visible! Refer to below image:

Excel 10
Your final result

Quote For the Day

The true delight is in the finding out rather than in the knowing

Isaac Asimov

You are finished. Please feel free to share this post! One way to share is via Twitter.

Just click the Tweet icon below. This will launch Twitter where you click its icon to post the Tweet.

Check out TechSavvy.Life for blog posts on smartphones, PCs, and Macs! You may email us at contact@techsavvy.life for comments or questions.

I Would Like to Hear From You

Please feel free to leave a comment. I would love hearing from you. Do you have a computer or smart device tech question? I will do my best to answer your inquiry. Just send an email to contact@techsavvy.life. Please mention the device, app and version that you are using. To help us out, you can send screenshots of your data related to your question.

The author’s Vietnam eBook on the Battle for Tra Bong: Events and Aftermath

How to View Excel Sheet/Workbook Statistics

If you need to see how many formulas, pivot tables, or form controls you have in a spreadsheet or workbook, check out the Workbook Statistics feature in Microsoft Excel.

If you need to see how many formulas, pivot tables, or form controls you have in a spreadsheet or workbook, check out the Workbook Statistics feature in Microsoft Excel. Let’s explore this feature.

This is for devices running Excel. Screenshots are from Excel in Office 365 on Windows 10

Dilbert and Issue
Copyright Scott Adams, Inc./Distributed by Universal Uclick for UFS

You may have found statistics in Word helpful for seeing the number of pages, words, or characters. Getting statistics in Excel can be just as useful. You may have a workbook for a class with specific requirements, or you may have a spreadsheet for business that you want to review for unnecessary elements.

View Your Sheet/Workbook Statistics

First, open your Excel workbook. Next, navigate to the Review tab. Now, click Workbook Statistics in the Proofing section. You can also press Ctrl+Shift+G. (Note that the shortcut will not work in Excel for the Web.) Refer to below image:

Stats 1
Accessing Workbook Statistics button

Now, a small window will open to display the data for your current sheet at the top and the entire workbook at the bottom. See below image:

Stats 2
Displaying one Sheet Statistics

If you want details for a different sheet in your workbook, close the Workbook Statistics window by clicking OK. Next click the tab for the sheet that you want to see and follow the same steps listed above. As a downside, the sheet and workbook name are not shown. See following image:

Stats 3
Displaying two Sheets and Workbook Statistics

Data Included

You can see a the following data with the Workbook Statistics feature. This is helpful for situations where you expect to see something in your current sheet or workbook and you do not, or vice versa. Statistics may differ slightly between the spreadsheet and the entire workbook.

Spreadsheet Statistics:

  • The end of the sheet (the last cell with data)
  • Cells with data
  • Tables and PivotTables
  • Formulas
  • Charts
  • Images and objects
  • Form controls
  • Comments and notes

Workbook Statistics:

  • Number of sheets
  • Cells with data
  • Tables and PivotTables
  • Formulas
  • Charts
  • External connections
  • Macros

You can view Workbook Statistics in Excel for Microsoft 365 on Windows and Mac as well as in Excel on the Web. The only difference is that Excel online does not display the complete data lists written above for sheets and workbooks.

The scientific theory I like best is that the rings of Saturn are composed entirely of lost airline luggage.

Mark Russell

That’s it. Please feel free to share this post! One way to share is via Twitter.

Just click the Tweet icon below. This will launch Twitter where you click its icon to post the Tweet.

Check out TechSavvy.Life for blog posts on smartphones, PCs, and Macs! You may email us at contact@techsavvy.life for comments or questions.

I Would Like to Hear From You

Please feel free to leave a comment. I would love hearing from you. Do you have a computer or smart device tech question? I will do my best to answer your inquiry. Just send an email to contact@techsavvy.life. Please mention the device, app and version that you are using. To help us out, you can send screenshots of your data related to your question.

The author’s Vietnam eBook on the Battle for Tra Bong: Events and Aftermath

How to View Excel Statistics

Microsoft Excel is getting a quick summary view of workbook statistics. This simple dialog box includes the boundaries of the sheets, tables, links, formulas and notes.

In a couple of clicks you can now view the workbook statistics.

This is for Excel in Office 365 on PCs and Macs

Dilbert and Data
Copyright Scott Adams, Inc./Distributed by Universal Uclick for UFS

First, open an existing Excel workbook. Navigate to the Review tab and click on it. In the menu bar, head to the Proofing group. You will see the icon Workbook Statistics, just click on it to view. Refer to below image:

Excel Workbook Statistics 1

There are details for current sheet and the entire workbook. It is similar to Microsoft Word’s Word Count feature.

I Would Like to Hear From You

Please feel free to leave a comment. I would love hearing from you. Do you have a computer or smart device tech question? I will do my best to answer your inquiry. Please mention the device, app and version that you are using. To help us out, you can send screenshots of your data related to your question.

The author’s Vietnam eBook on the Battle for Tra Bong: Events and Aftermath

How to Format a Zip Code in Microsoft Excel

When entering numbers into Microsoft Excel, leading zeros are removed by default. This can be problematic for ZIP codes, phone numbers, credit/debit card numbers and IDs that you type into a cell. We are going to explore some options on fixing this Excel behavior.

If you want to keep a leading zero on the fly, you can enter an apostrophe (‘) before you enter the number that begins with zero. Excel treats the number as a text field. The apostrophe (‘) is not displayed and calculations will still work. But who wants to do this every time, there has to be a better way.

This is for Excel for Office 365 Windows and Mac versions. Other versions of Excel will be similar.

Create the Excel Sheet

Create a simple Excel sheet like the example below:

Zip Code Format 1
Excel Sheet for Zip Codes

Setup the Zip Code Format

  • Select a cell or range of cells to format; in my case G2 thru G6
  • Click “Ctrl+1” to load Format Cells dialog. Also, you can right click and select Format Cells.
  • Select the Number tab
  • Select Custom from the Category list
  • In the Type box, type in 00000 for a five digit zip code or 00000-0000 for a nine digit zip code. This allows leading zeros to be placed in the cell, you only have to enter the Zip code numbers. This is not intuitive, you think you have to select a format from the list. Refer to the following image:
Zip Code Format 3
Setup Excel Sheet format

Using the Special Zip Code Format

You can also click Special, then select Zip Code or Zip Code + 4. In Google Sheets, this special Zip code format is not available, but you can enter the format of leading zeros. See the following example:

Zip Code Format 2
Excel Special Zip Code format
  • Click OK to apply the format. The 00000 or 00000-0000 format is saved in the Type list for future use.

This will only effect Zip Codes that are entered after the format is applied.

You can also format the Zip Code as Plain Text. Anything you enter will show exactly how you typed it in text.

To do this:

  • Select your data range
  • Press “Ctrl+1” to launch the Format Cells dialog box
  • On the Number tab, click Text

What about Zip Codes entries that have more than 5 digits? We can use a Conditional Format in an adjacent column to flag the invalid Zip codes. I used the formula; if the length (cell reference)>5 is True then present an “Invalid Zip” message, if the expression is False, then no message is presented.

Flagging Invalid Zip Codes

  • Create a column adjacent to the Zip Code and label it Error Message
  • Set the Conditional Format for the first cell adjacent to the Zip Code. In my example, it is cell G2
  • Type in this formula, =IF (LEN(your cell reference)>5,”Invalid Zip”,””)
  • Copy this formula, then highlight a range of cells, then Paste

See the following image for the Invalid Zip message related to cell G2 and G6, both have more than 5 numbers. An important note, Excel lets you enter as many digits as allowed, there is no truncation. The template of 00000 formatting is for adding leading zeros if the number of digits is less than 5.

Zip Code Format 5
Flagging Invalid Zip Codes screen

I Would Like to Hear from You

Please feel free to leave a comment. I would love hearing from you. Do you have a computer or smart device tech question? I will do my best to answer your inquiry. Please mention the device, app and version that you are using. To help us out, you can send screenshots of your data related to your question.

The author’s Vietnam eBook on the Battle for Tra Bong: Events and Aftermath


How to Add an Excel Watermark to Your Sheet

In Microsoft Excel, you can add a watermark, sort of, to an Excel sheet. How to do this is not intuitive. In Microsoft Word you have templates to chose from such as “Confidential” or “Do Not Copy” for a watermark.

I am going to discuss one method; adding an image background as a watermark. We are going to insert an image which could be a photo or a company logo. Let’s see how to implement this watermark.

This is for Excel for Office 365 Windows and Mac versions. Other versions of Excel will be similar.

Your Excel Sheet

  • Create an Excel spreadsheet or use an existing one. Refer to my newly created sheet (Sheet1) below:
Excel Watermark 1
My Excel sheet
  • Click Insert>Text>Header & Footer
xcel Watermark 3
Inserting a Header in the middle column
  • Select Picture

Select Your Watermark

Select your option for inserting a picture. Refer to following screenshot

Excel Watermark 4
Options for selecting a watermark image
  • Select your image
  • Click Insert
  • You will see &[Picture] in the Header.
Excel Watermark 5
Your Header screen without the watermark being shown

View Your Watermark

  • Tap anywhere outside the Header to see your watermark. Refer to following screenshot for my selection of a logo:
Excel Watermark 8
My Excel sheet with a logo as a watermark

Formatting Your Watermark

To format the image:

  • Tap anywhere outside the Header
  • Click Insert>Text>Header & Footer
  • Select Format Picture. You will see the following screen:
Excel Watermark 9
Resize your watermark

From here you can resize the image

  • Click the Picture tab
  • Select the Color box and change it to the Washout option
  • Click OK. This allows the background image to be less intrusive.
Excel Watermark 10
Using the Washout option

Refer below to my final capture of the watermark screen:

Excel Watermark 11
My final screen with the watermark background dimmed in order to see the cells contents
  • Save your spreadsheet and close or exit Excel

For a Microsoft Word look-a-like watermark, use the WordArt feature in Excel.

I Would Like to Hear from You

Please feel free to leave a comment. I would love hearing from you. Do you have a computer or smart device tech question? I will do my best to answer your inquiry. Please mention the device, app and version that you are using. To help me out, you can send screenshots of your data related to your question.

The author’s Vietnam eBook on the Battle for Tra Bong: Events and Aftermath

Want to Print Nonadjacent Ranges in Excel?

Normally, we chose an adjacent range of cells with headers for printing in Excel. However, there are occasions we want to print nonadjacent cell ranges. There are some of us who didn’t realize you could do this in a single print area. Let’s see how this is done.

This is for Excel for Office 365 Windows and Mac versions. Other versions of Excel will be similar.

Dilbert Touching
Copyright Scott Adams, Inc./Distributed by Universal Uclick for UFS

First Method of Selecting Cells

One method is holding down the “Cntl” key while selecting the range of cells you want in your Print Area.

  • Select your first range of cells
  • Press and hold the “Cntl” key
  • Select additional ranges of cells
  • Release the “Cntl” key
  • Click the Page Layout tab
  • Click Print Area
  • Click Set Print Area. See following image for my selection of nonadjacent cells in Print Area:
Excel Print Area 1
Selecting nonadjacent cells Print Area

Please note that each range you selected will print on a separate page in the same order that you selected regardless of cells location. Also, your current page settings will apply to all your pages. For example, you are unable to mix Landscape and Portrait printing.

Second Method of Selecting Cells

Another method is adding nonadjacent cells to an existing Print Area.

  • Select a range of cells you want to add to your Print Area
  • Click the Page Layout tab
  • Click Print Area
  • Click Add to Print Area. Refer to below image:
Excel Print Area 2
Adding a nonadjacent cell range to Print Area

As with the first method, each range will print on a separate page in the order selected and with the same print settings.

Locate the Print Area

In the Name box to the left of the Formula bar, click it’s drop down arrow and select Print_Area. See following image:

Excel Print Area 3
Using the Name box to show the Print Area

Alternatively, from the View tab, click Page Break Preview in the workbook Views group to see the Print Area.

Click Normal to return to default Excel view.

Two Methods on Printing Your Ranges

You may not want each nonadjacent cell range printed on a separate page. You have two options:

  1. Move the cell ranges adjacent to each other and reset your Print Area
  2. Before printing, select the option to Ignore Print Area. The Active Sheet is now ready for printing. Your Print Area is still saved, you are just ignoring it. Refer to following image:
Excel Print Area 4
Ignoring the Print Area for printing

I Would Like to Hear from You

Please feel free to leave a comment. I would love hearing from you. Do you have a computer or smart device tech question? I will do my best to answer your inquiry. Please mention the device, app and version that you are using. To help us out, you can send screenshots of your data related to your question.

The author’s Vietnam eBook on the Battle for Tra Bong: Events and Aftermath

How to View Two Excel Worksheets From the Same Workbook Side by Side

There is a way to compare the contents in two sheet tabs in the same workbook. Lets see how this is done. In my example, Sheet1 has eleven rows, Sheet2 has ten rows. See following image:

Excel Side by Side 1
The two sheets

This is for Excel for Office 365 Windows and Mac versions. Other versions of Excel will be similar.

Opening a Second Window for Comparing Contents

In the View tab of the Window group, click New Window

Excel Side by Side 2
Setting up for a new window

A second window of the same workbook opens, like a clone. At the end of the workbook name is a number denoting the sheet, either a one or a two. The new window becomes the active sheet.

Excel Side by Side 3
The two windows

Setting Up Side by Side Viewing

In the View tab of the Window group, click View Side by Side

A Compare Dialog box may appear. If so, choose the sheet you want to compare with the active sheet.

Click View Side by Side. When you select this view, Synchronous Scrolling should already be turned on. This allows you to scrool both worksheets at the same time. If its not turned on, click the View tab, then click Sychronous Scrolling. See below image:

Excel Side by Side 5
Setting up for viewing side by side

If the two windows didn’t arrange side by side, from the View tab, click Arrange All>Vertical and check the box for Windows of active workbook. Refer to following image:

Excel Side by Side 6
Setting up how to view the side by side comparison

Viewing the Two Sheets Side by Side

You can now synchronously scroll both up and down, left and right to compare the contents of the two sheet tabs in the same workbook. See final image below:

Excel Side by Side 7
Comparing the two sheets in same workbook

When you are finished, to restore your window size, close one of the two windows, then click the Maximize Button in upper right hand corner of the worksheet window.

I Would Like to Hear from You

Please feel free to leave a comment. I would love hearing from you. Do you have a computer or smart device tech question? I will do my best to answer your inquiry. Please mention the device, app and version that you are using. To help us out, you can send screenshots of your data related to your question.

%d bloggers like this: